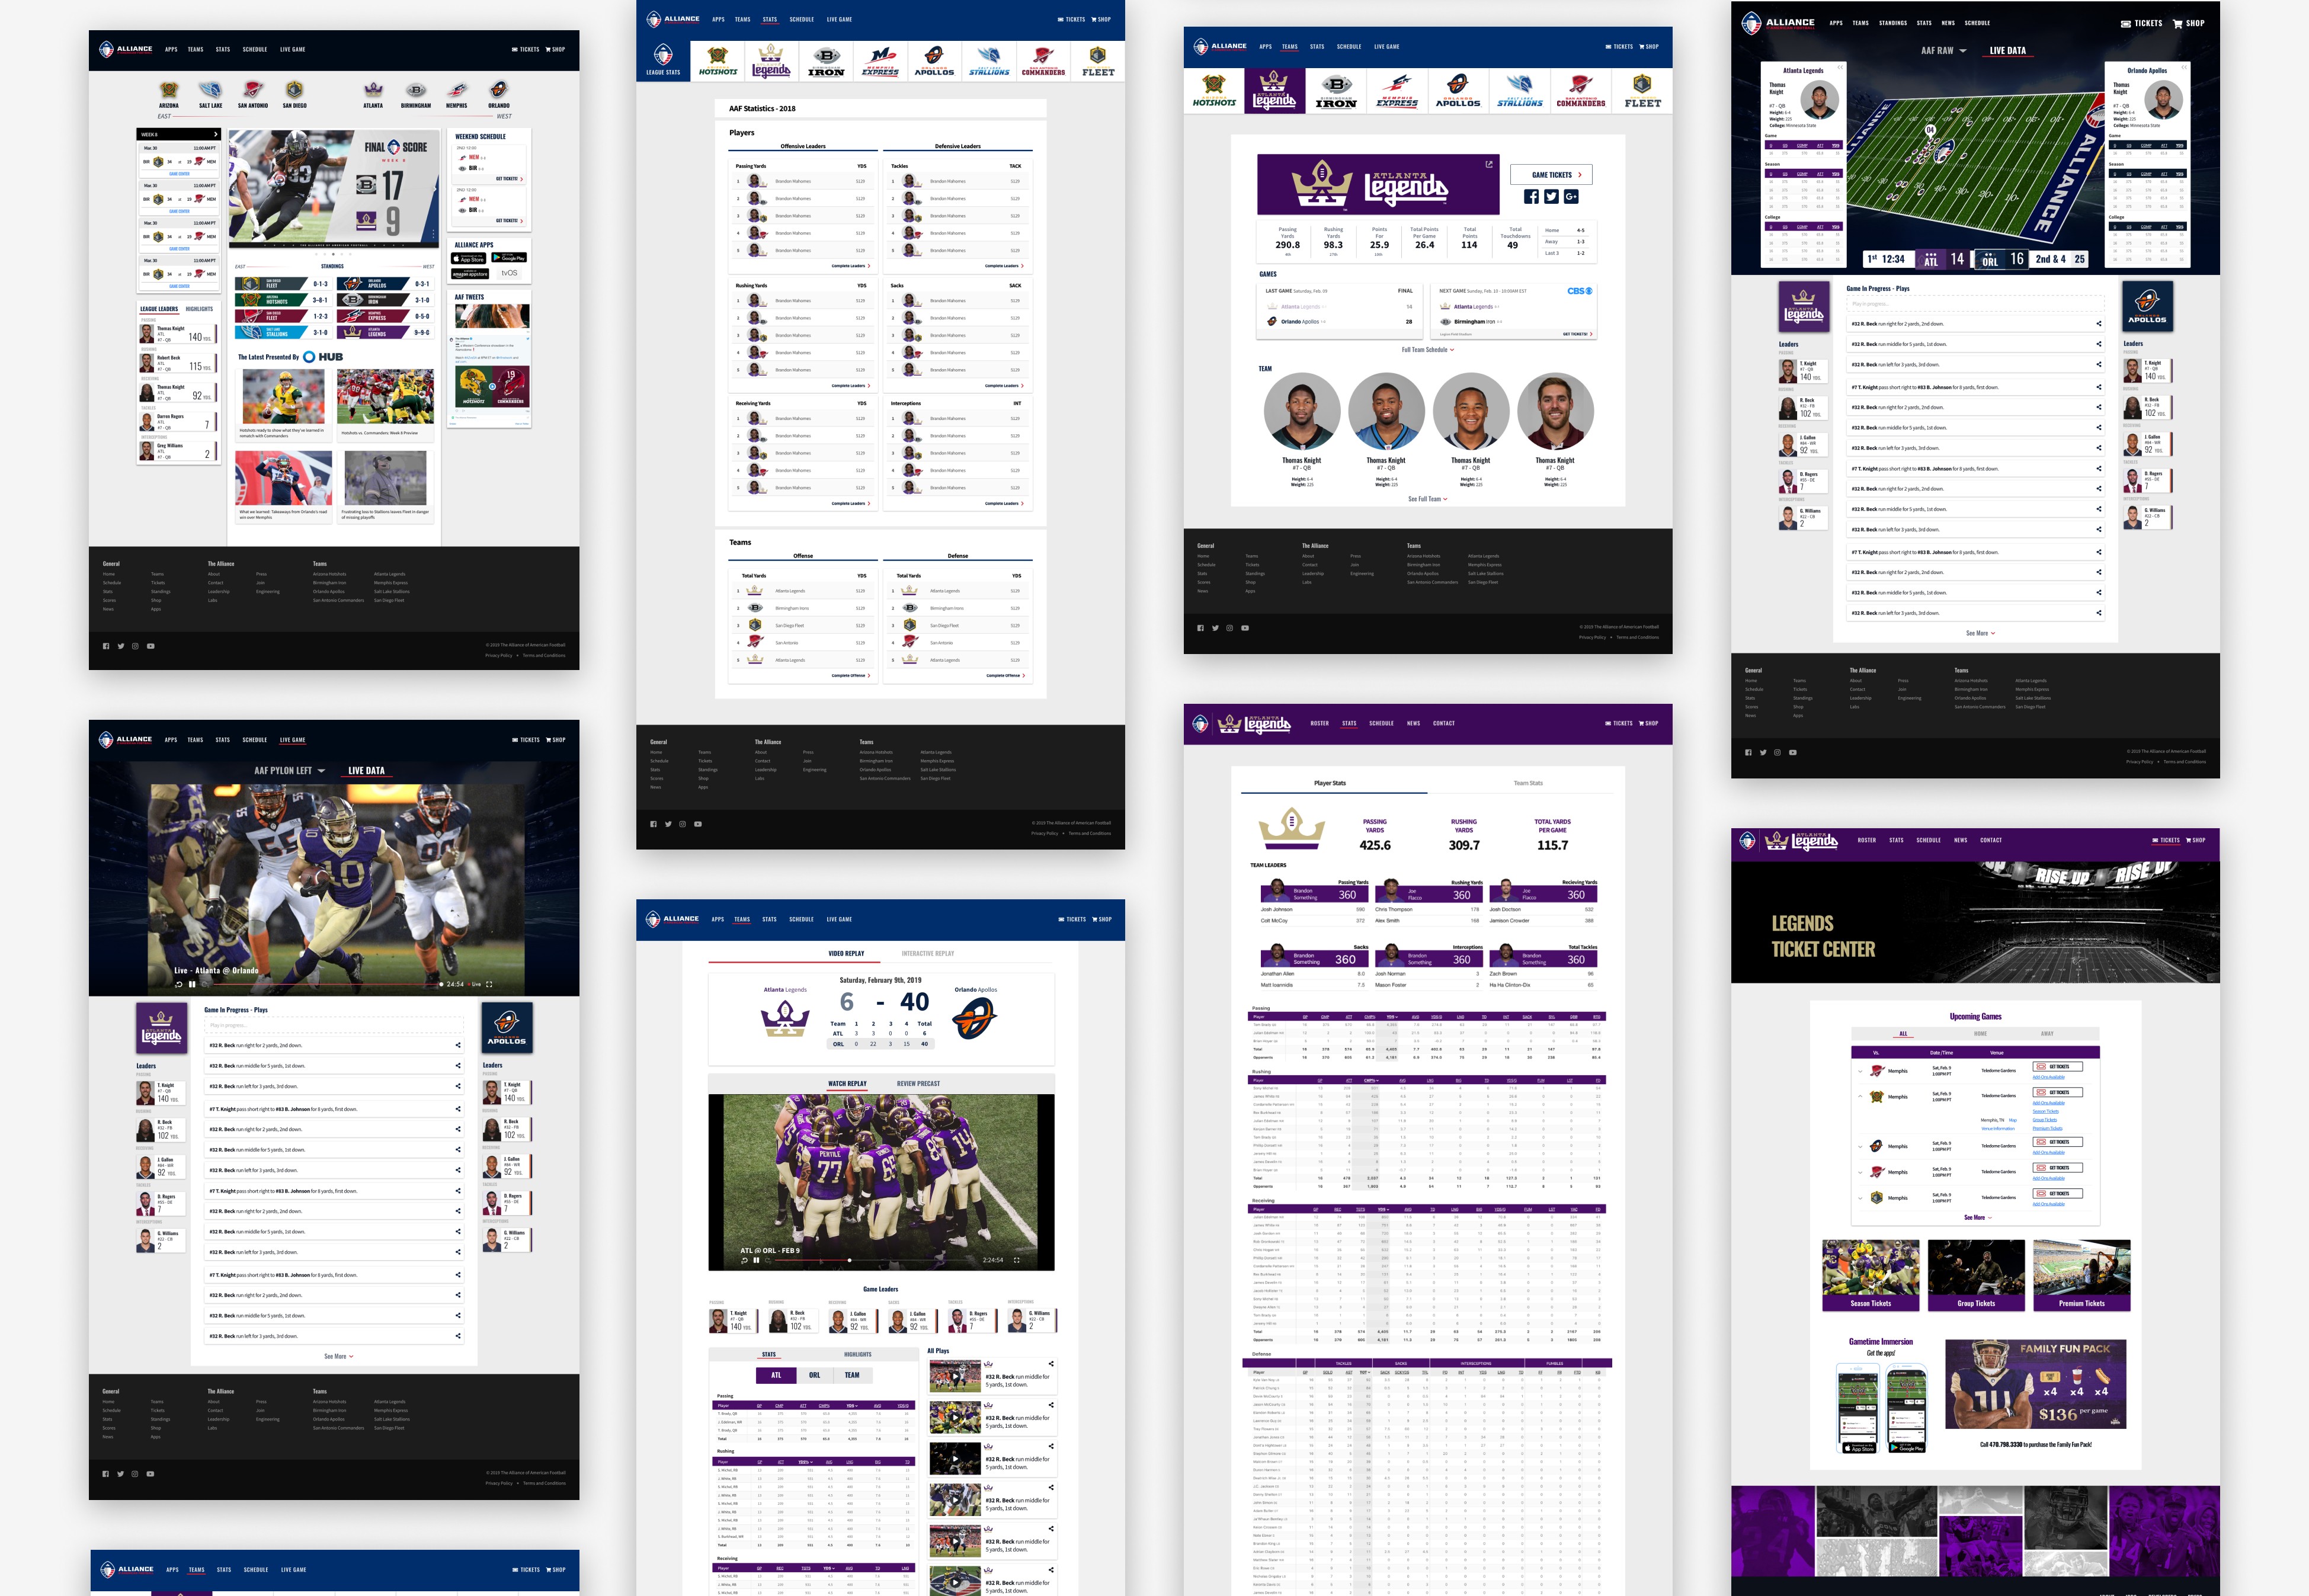
Background
The Alliance of American Football league offered fans an immersive digital experience where they could interact on a play-by-play level through the mobile app and web platform. The web platform team was assembled 2 weeks before the kickoff of the season. The platform had to launch at the start to be iterated on through the season. The AAF was founded by Charlie Ebersol and Bill Polian in 2019. The league was scheduled to have a 10-week regular season and conclude with a championship game on April 27. After eight weeks of play, however, the league's football operations were suspended by controlling owner Thomas Dundon on April 2.
Role
Product Designer
TeAM
Director of Product
Web Platform Engineering Team
Problem Space
Current User Journey
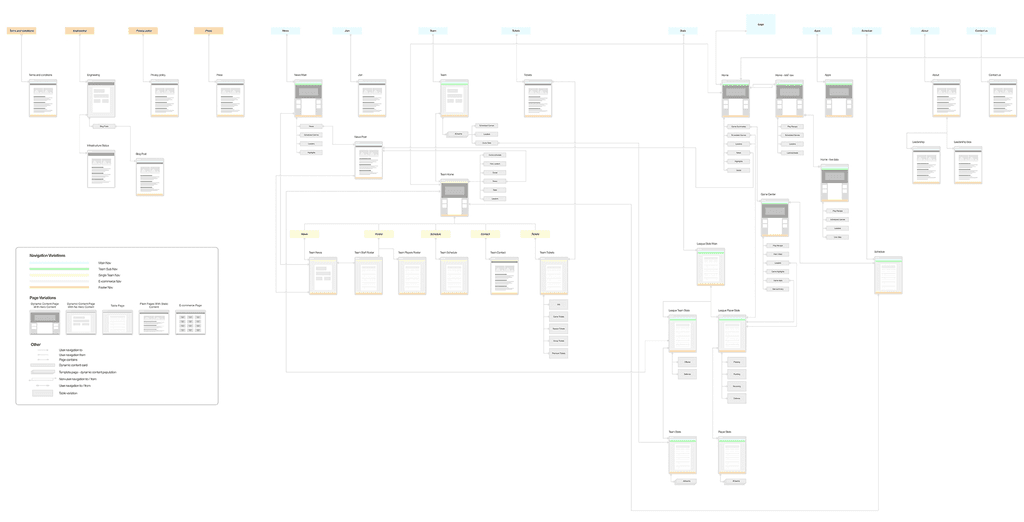
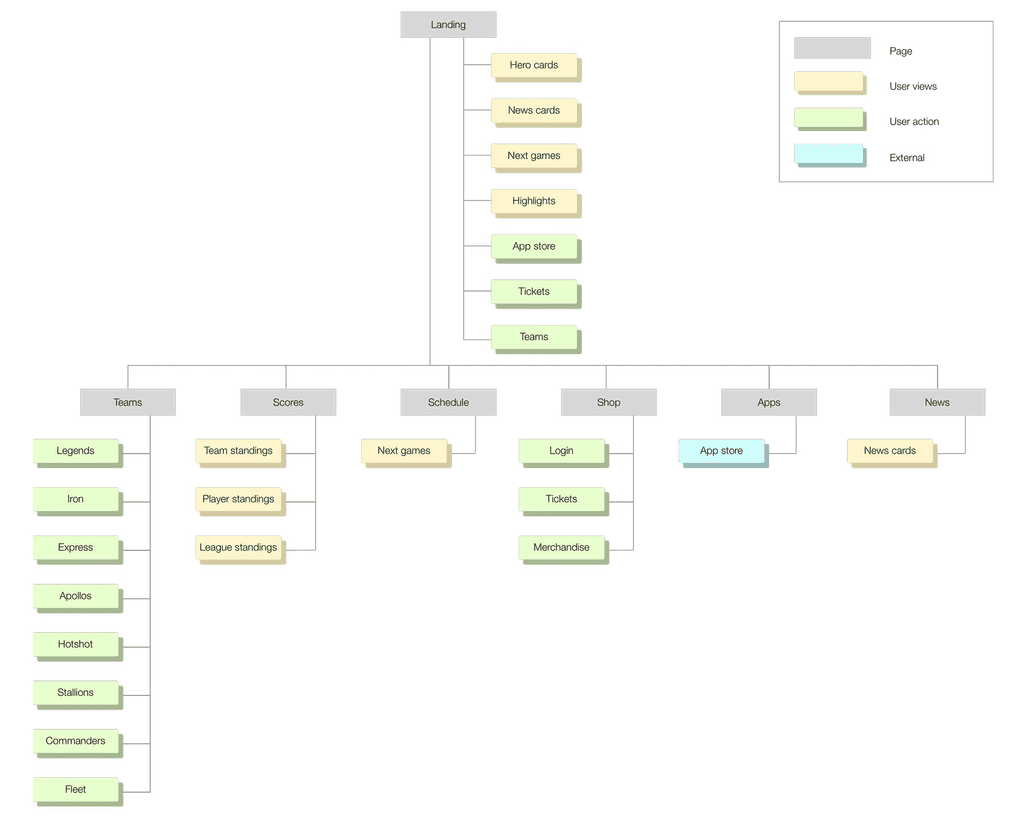
The existing web platform housed convoluted user journeys, making it too easy for users to become disoriented. Additionally, we identified redundant areas with multiple paths to accomplish the same task. One fan's remark summed it up: 'I feel like I have to jump through hoops to access my team's stats.' To address these issues, I streamlined the information architecture and identified opportunities for consolidating user flows wherever feasible.
Points of user friction – too many in the existing state
The consolidated information architecture reduced the time to completion of key user journeys by a third.
Defining Patterns
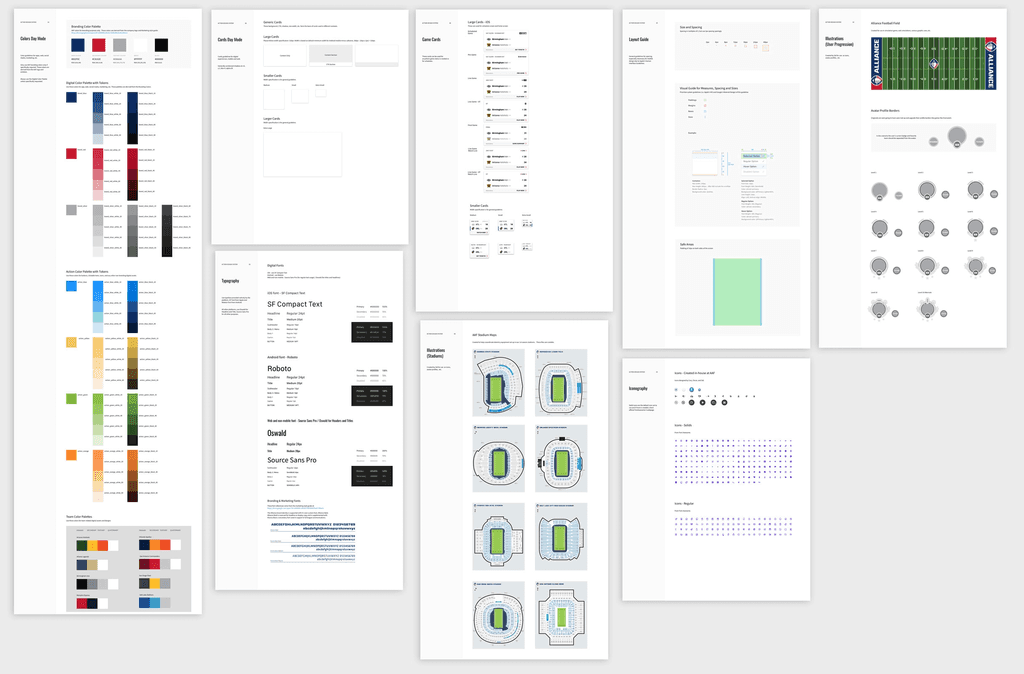
Before the formation of our web team, the platform had multiple owners, including the league's marketing team and individual team managers. This resulted in inconsistent patterns and visuals due to the absence of a unified design system. We promptly addressed this issue.
Performance Analysis
Quantitative ANalysis + User Interviews
We established a weekly process for reviewing and analyzing traffic analytics with the product data team. In addition, the product owner and I conducted regular user interviews to complement the quantitative metrics. Our analyses focused on isolating trends related to our two main objectives, while also identifying opportunities where synergistic patterns emerged.
Boost Viewership
Interviewees reported they desired more interaction during games
Interviewees ranked most favorable - feature to switch between cameras
Interviewees noted real-time stats as a key to the game experience
Driving Ticket Sales
Of all traffic between games
was on mobile web
Sessions containing stats review were
more likely to result in tickets purchase
Active social media users were
more likely to purchase in bulk
Mobile Web
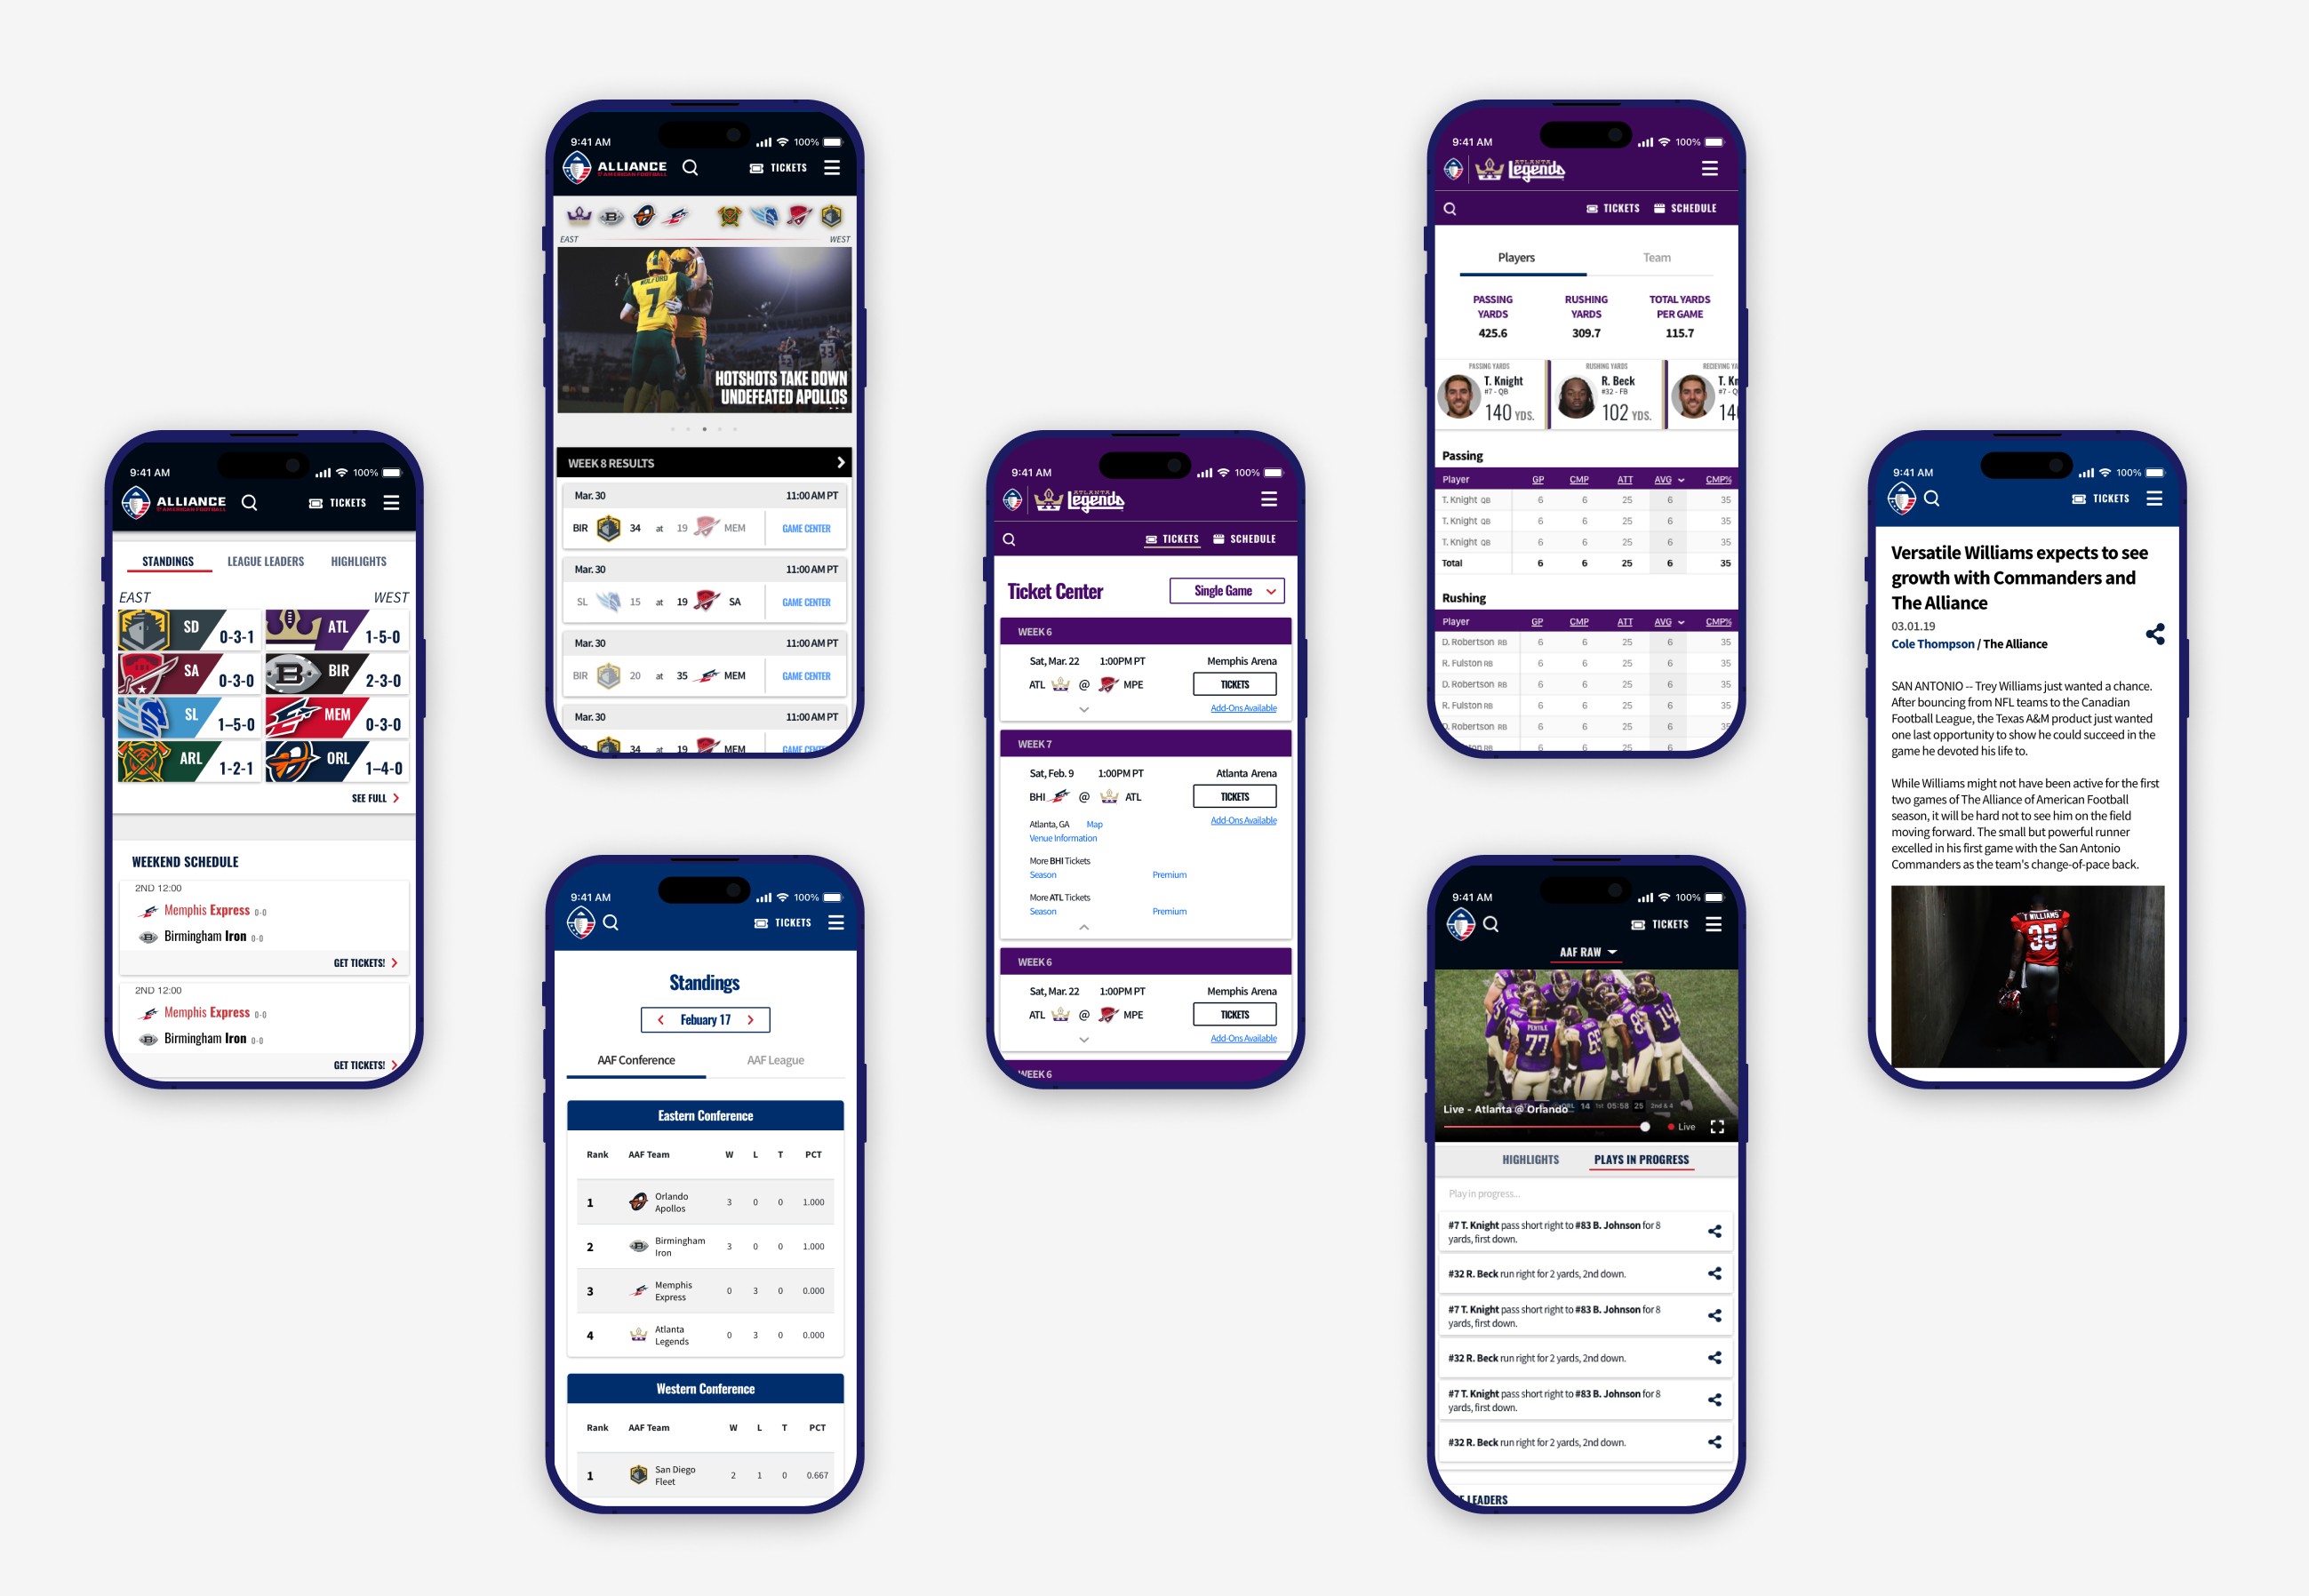
After conducting in-depth analysis of our fans' user journeys, we focused on optimizing the mobile user experience for the critical ticket purchasing journey. This involved streamlining access to statistics and ensuring that the most relevant ticket purchasing actions were directly accessible from any statistics page.
Desktop App
We optimized the desktop experience for fans to discover the interactive game center during live games. An early mistake we made was automatically redirecting the landing page to the game center during a game. Feedback from users revealed that they felt their experience was being hijacked when they simply wanted to look up a stat. Additionally, we found that the game center had difficulty loading on older computers, compounding the issue caused by our decision to convert the landing page during live games. we learned from these initial missteps and adjusted our approach to ensure a smoother and more user-friendly experience for fans accessing the game center during live games.
Results
Our team completed 3 major iterations of the web platform and we saw improvements through each.
Boost Viewership
22,875 viewers
From 8,565 in the 1st game
Driving Ticket Sales
+20%
Increase over 5 game weekends
